Block Copolymer Phase Prediction using Graph Neural Network Architectures
Adapted From a Project for Stanford CS224W: Machine Learning with Graphs
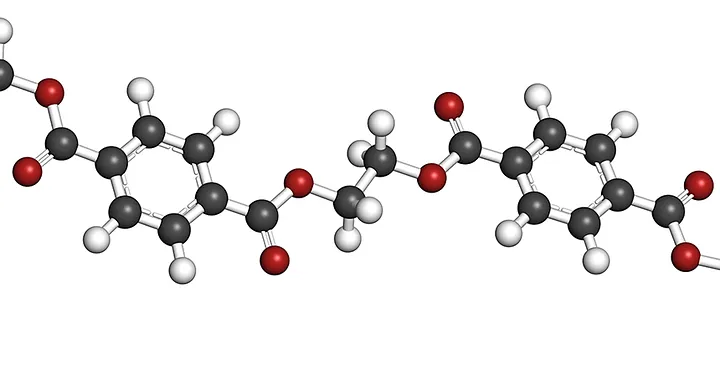
Perkins, S. (2022, June 30). Explainer: What are polymers? Science News Explores. Retrieved March 22, 2023, from https://www.snexplores.org/article/explainer-what-are-polymers
The world of materials science is undergoing a remarkable transformation, along with the rest of the world it is being sculpted by the convergence of cutting-edge A.I. technology and innovative research. While giants like protein folding and drug-interaction receive most of the attention in the world of A.I. - assisted natural sciences, there are lesser known developments that also deserve recognition. Among these underdogs are the demure but compelling polymers, more specifically, block copolymers.
Block copolymers are a class of polymer that are composed of two or more distinct monomers chemically joined to create a single molecule (the specifics here are unimportant to the fun A.I. stuff but it`s included for the chemistry nerds). The materials that block copolymers form exhibit a wide range of microstructures and properties that make them useful for a variety of applications including materials science, nanotechnology, and biomedical engineering. However, the study of block copolymers is often limited by the high computational cost of traditional self-consistent field theory simulations (again, unimportant to the fun A.I. stuff, but included for the nerds). While these simulations are valuable tools for the characterization of block copolymers, their iterative nature makes it difficult to perform large-scale simulations in reasonable amounts of time.
The goal of this study is to address the feasibility of using graph neural networks to replace these expensive traditional computations. Recent work has shown the ability of random forest models to closely approximate block copolymer phase behavior with greatly reduced computation time[1]. However, this method is not adequately able to capture more geometrically complex copolymer structures (plus it is not nearly as fun as using graphs).
Data - Where is it and Why is There None:
One of the primary challenges faced by current researchers in the field of copolymer science is the scarcity of comprehensive, accessible data. Until recently, large amounts of the available polymer data was scattered across various articles, patents, and technical reports. Only recently has a more comprehensive database been constructed, and still it only holds 5300 entries and is limited in scope. In 2021, the Olsen Lab at MiT released the Block Copolymer Phase Behavior Database (BCDB) which was constructed by manually curating the aforementioned sources[2]. Although this serves as a valuable resource, it does not extinct the need for more extensive and diverse datasets.One of the primary challenges faced by current researchers in the field of copolymer science is the scarcity of comprehensive, accessible data. Until recently, large amounts of the available polymer data was scattered across various articles, patents, and technical reports. Only recently has a more comprehensive database been constructed, and still it only holds 5300 entries and is limited in scope. In 2021, the Olsen Lab at MiT released the Block Copolymer Phase Behavior Database (BCDB) which was constructed by manually curating the aforementioned sources[2]. Although this serves as a valuable resource, it does not extinct the need for more extensive and diverse datasets.
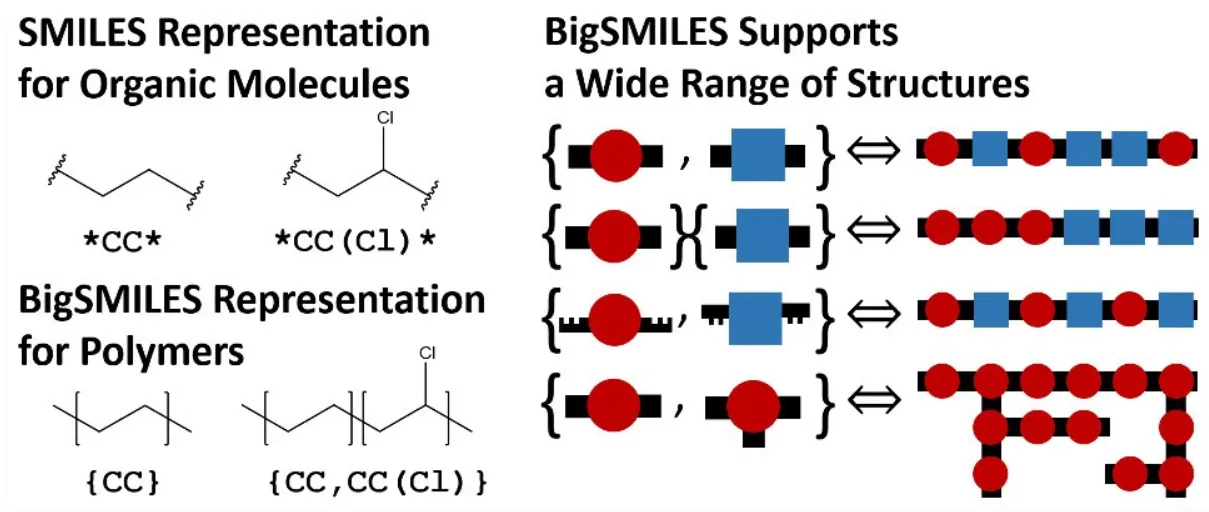
Now that we have identified a database, what is the actual data and how do we turn it into graphs? Well that is a great question my astute observer. The BCDB contains a list of polymeric experiments that identify the polymer string as well as the conditions of the experiment, and finally, the resulting phase behavior under the given conditions. Most of this data can be converted to numeric representations, however, the polymer string itself is defined using a notation called BigSMILES[3]. BigSMILES is a representation system that captures the stochastic nature of polymers in a simple, compact string, making it particularly useful for representing complex structures in readable formats. BigSMILES is an addition to the widely used Simplified Molecular-Input Line-Entry System (SMILES), however, it incorporates special notation for polymers. A visualization of how BigSMILES can support diblock copolymers (polymers with two distinct, repeating monomeric units) can be seen in the image taken from the BigSMILES paper[3] below.
It is important to note that although the BigSMILES[3] notation is able to capture information about the polymer blocks, it is unable to capture the exact ordering of the blocks in each polymer chain. This is due to the stochastic nature of how polymers form and is a limitation of the current representation systems.
For a more concrete example, we will look at the BigSMILES representation of everyone`s favorite polymer: poly(styrene-co-styrene sulfonate)! *Yay!*
{[$][$]CC(c1ccccc1)[$],[$]CC(c1ccc(S(=O)(=O)O)cc1)[$][$]}
Here we can see that this polymer has two blocks which we will call the A and B blocks. The A block is CC(c1ccccc1) while the B block is CC(c1ccc(S(=O)(=O)O)cc1). The [$] notation describes connection points between the two blocks.
Here we can see a visual representation of each of these blocks, as well as an example of how they can combine to form longer chains. This visualization also gives insight into the motivation for using a graph-based approach to polymer modeling. Although the BigSMILES string does contain the same information as the graphs shown above, a machine learning framework would need to learn how to correctly interpret BigSMILES strings in order to accurately understand the polymers. For this reason, we are exploring graph-based approaches.
The Joys and Challenges of Polymer Graphs:
There are a couple features of block copolymers that make them difficult to model, with the main challenge coming from their inherent stochasticity, as previously mentioned. To better understand this phenomenon, think of a block copolymer as a beaded necklace that you are making with your niece (if you don`t have a niece you can just pretend, it is ok). You have a set number of red and blue beads which represent the two blocks of our diblock copolymer. You know the relative quantities of each bead color, however, you are severely colorblind and cannot tell the difference between them as you string them together (much to the behest of your niece). This represents the stochasticity that occurs when block copolymers form. Although we know the relative volume (called the volume fraction), we do not know the order in which the blocks will be structured. This makes it challenging to build a graphical representation of the polymer structure. In addition, the number of blocks can reach well into the hundreds making graphical representation very long and sparsely connected… So why did we choose to use a graph neural network…Yes, why indeed...
It turns out, that despite some of these issues, there are several reasons a graphical representation may be beneficial over a vector-based approach (as used in the random forest model):
- Ring structures are much easier to model with graphs.
- Branched chains are much easier to model with graphs.
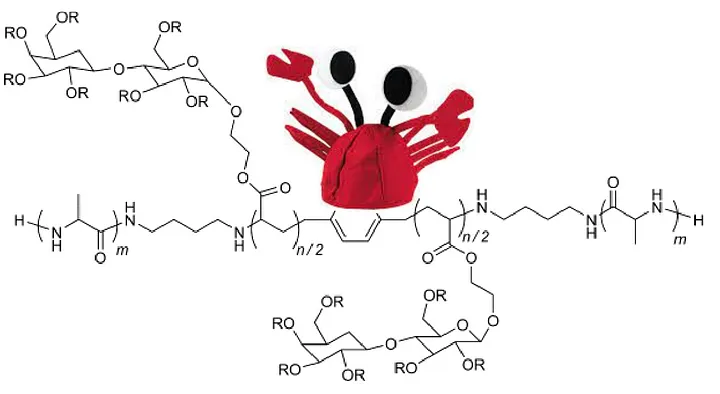
- Graphs are just more fun. Look at that polymer graph and its silly hat. Look at how fun it is.
*Note: The polymer graph does not actually wear a crab hat, but it could if it wanted to.
J.K. Kallitsis and A.K. Andreopoulou. 6.19 — rigid-flexible and rod-coil copolymers. In Krzysztof Matyjaszewski and Martin Möller, editors, Polymer Science: A Comprehensive Reference, pages 725-773. Elsevier, Amsterdam, 2012.
As mentioned before, although BigSMILES notation can capture all of the important information in a polymer, in order for a machine learning framework to build meaningful representations of polymer structures, it must first learn how to understand the semantics of the string notation. Using a graph-based approach allows us to eliminate this extra learning step, allowing the model to focus more on building understanding of the polymer itself rather than the language used to describe it.
Modeling Specifics:
Because of the previously mentioned challenges of modeling stochastic objects in graphical form, careful considerations were taken on how to model each node, edge, and graph.To avoid overcomplicated feature representations from confusing both us and the model, we decided to try to distill each polymer to only its most valuable attributes. What we ended up with are the following:
- Node-Level Attributes:
- Element Classification: a dictionary containing all possible elements was used as an index to provide a numerical classification for the model (i.e. is this node a carbon atom, a nitrogen atom, etc.)
- Atom Subgroup Classification: this labels each node in the graph as either belonging to a functional group (i.e. cannot be stochastically repeated in the polymer chain) or belonging to the A or B block. Each block receives a different label, which is important for the next node attribute.
- Volume Fraction Indication: for each node that has an A or B block classification, we assign the corresponding volume fraction as a feature for the node. The hope is that the model may be able to recognize a correlation between the volume fraction and inherent properties of the polymer. Although this is quite a large assumption, we have opted to use it as a surrogate to try and obviate the need to explicitly model stochastic polymer chains.
-
Edge-Level Attributes:
- Bond Classification: similarly to the element classification before, we used a dictionary containing all possible bond types to provide a numerical classification for the model (i.e. is this bond a single bond, double bond, or more fancy weird special bond).
-
Graph-Level Attributes:
- Graph ID: this is a boring one, but necessary. This is used to identify which graph is which from our input data
- Temperature: temperature is one of the key factors in predicting phase behavior of polymers, however, it is an external factor and is not specific to any nodes or edges. It is therefore added as a graph-level attribute.
- Molar Mass: similarly to temperature, this feature is a key factor in predicting phase behavior, but it represents a more global property of the graph and is also included as a graph-level attribute.
Training Framework:
One of the less fortunate aspects of graph neural networks are their sensitivity to input architecture. Small changes in model parameters can have significant impacts on performance, making parameter choice a paramount concern for high level prediction tasks. To counteract this phenomenon, we conducted a grid search (I know, boo grid search) over the following parameters for a total of 36 distinct runs before selecting the optimized model parameters.Task: ['graph classification']
GNN Type: ['gcnconv','gatconv','ginconv']
Preprocessing MLP Layers: [1]
MLP Layers: [4]
Postprocessing MLP Layers: [1]
Feature Concatenation: ['stack']
Batch Normalization: [True,False]
Activation Function: ['prelu']
Dropout Rate: [0.0,0.4]
Aggregation Function: ['add','mean','max']
Optimization Algorithm: ['adam']Results:
A summary of the resulting model performance can be seen in the table below.| GNNLayer Type | BatchNorm | Dropout | Aggregation | Test Classification Accuracy |
|---|---|---|---|---|
| GCN (best) | True | 0.0 | Mean | 0.7156 |
| GCN (worst) | True | 0.4 | Max | 0.5217 |
| GAT (best) | False | 0.0 | Sum | 0.7269 |
| GAT (worst) | True | 0.4 | Mean | 0.4765 |
| GIN (best) | False | 0.0 | Max | 0.7137 |
| GIN (worst) | True | 0.4 | Sum | 0.5367 |
Optimal Model Accuracy (GATConv with no Dropout)
Additional studies in the field have shown promise for machine learning frameworks in polymer phase classification. A recent study shows that random forest architectures can achieve up to 90% accuracy on phase label prediction using the same BCDB database[1]. Unfortunately, this seems to intuitively contradict our earlier thinking that graphical representations can represent more complex polymer structures, but it is important to consider other factors that may be involved in the random forest modeling. The size and computational resources used to create this model are unknown, making a direct comparison impossible (and leaving convenient space for further research…) Weighted directed message passing neural networks (wD-MPNN) are also seen in recent literature for classifying phase behavior of polymers. One study was able to achieve classification accuracies of up to 68%[5]. This network type also employs a graph-based approach, which may not be immediately evident from its ~cryptic nomenclature~. Overall we can see that our models were able to perform comparably with existing graph-based models, but still falls short of more established machine learning frameworks like random forests. These results are promising for the continued study of graph neural networks in polymer science and hopefully help to inspire further researchers to continue similar work!
Discussion:
The largest assumption made in this study is our method of modeling stochasticity in block copolymers. While we opted to only model a single block for the A and B blocks, another approach we considered was to generate full-length block copolymers using random sampling and use those as inputs to the GNN. This method was rejected for this study due to its significant increase in computational expense, however, this increased realism may yield a more accurate understanding of copolymer structures when run through GNN architectures.Another limitation of this study lies in the ability for our model to accurately denote block cycles. In many polymers, there exists predictable cyclic patterns that can emerge in the A and B blocks, and although these chains are still stochastic, being able to predict more repeatable chunks may help increase complex behavior of the polymers. Our current model does not address this phenomenon for a variety of reasons, one of which is that it is hard to do. Realistically, though, this presents another opportunity for further study and potential improvement of GNN accuracy in this task.
Lastly, the data in this field of research is still extremely limited. The BCDB database is the most comprehensive publicly available block copolymer database and still it only represents 61 different polymers (note that since temperature and molar mass impact phase behavior, several experiments can be run on the same polymer, which bumps the total number of experiments in BCDB to 5300). Without an increase in publicly available data, the opportunities for further research will be severely hindered. The absence of extensive datasets also limits opportunities for interdisciplinary collaboration, particularly between experimentalists and computational scientists. In order to foster progress in polymer science, it is crucial to address the data gap and develop strategies to facilitate the collection, curation, and sharing of high-quality polymer data. So please, beg your local polymer chemist to give you their secrets and release them to the world!
References:
[1] Akash Arora, Tzyy-Shyang Lin, Nathan J. Rebello, Sarah H. M. Av-Ron, Hidenobu Mochigase, and Bradley D. Olsen. Random forest predictor for diblock copolymer phase behavior. ACS Macro Letters, 10(11):1339-1345, 2021. PMID: 35549019.[2] Mochigase, Lin, Audus, Olsen, Rebello, Arora. Block Copolymer Phase Behavior Database (BCDB), 5 2021.
[4] Jiaxuan You, Rex Ying, and Jure Leskovec. Design space for graph neural networks. In NeurIPS, 2020.
[5] Matteo Aldeghi and Connor W. Coley. A graph representation of molecular ensembles for polymer property prediction. Chem. Sci., 13:10486-10498, 2022.


